


Is this “No Cost” resource actually costing your organization a lot?
By: Workbench Energy
June 9, 2020
For large power consumers in Ontario who participate in the Industrial Conservation Initiative (ICI), coordinating their energy reduction efforts with the hours that the Ontario grid experiences its highest peak demand is critical. In fact, up to 70% of large power consumer’s electricity bill can be impacted by the 5 coincidental peaks of the year. Despite the success of the ICI for effectively reducing provincial demand at peak times and keeping Global Adjustment costs relatively low for energy intensive businesses, determining when the 5 Ontario peak hours are likely to occur is challenging.
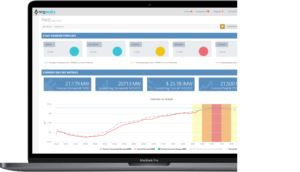
A frequently used no-cost resource is the Peak Tracker offered by the Independent Electricity System Operator (IESO). This one-page dashboard consists of IESO”s power data, in particular, the demand forecast for the day-at-hand and the range of the current top ten peaks for the year. Guidance on the Peak Tracker dashboard advises that “If today’s pre-dispatch demand forecast comes close to this range (of the current top ten peaks), a new Top 10 Ontario Demand peak may be reached”. In the absence of other sources of information, the Peak Tracker offers participants of the ICI program somewhere to access data about when a peak might occur. For any Global Adjustment Class A businesses using the Peak Tracker alone, it is important to understand the limitations of the tool, its historical accuracy, and what an alternative approach would look like with a premium service like NRG Peaks, offered by Workbench Energy.
Limitations of the IESO Peak Tracker
The Peak Tracker is designed to share basic data such as the IESO forecast for the day and the current top ten demand peaks. Here are some of the limitations:
No Proactive Notifications
The onus is on you to check-in. There are no notifications for upcoming peak days, and no warnings on days when IESO forecasts are off-mark or have changed.
When to Start Curtailments?
Setting intelligent thresholds for when to initiate load reduction activities can greatly reduce the number of hours you curtail in a year.
AQEW Not Considered
Peaks are adjusted by the AQEW which has the ability to shift the peak hour and day. Peak tracker is displaying pre-dispatch demand forecasts which excludes AQEW consideration.
Doesn’t Identify Unusual Peaks
Often misses shifting peak hours as probabilities change of earlier or later peaks.
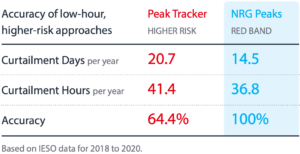
Historical Accuracy
While organizations may approach ICI peak reduction strategies differently, we have modeled a conservative and a higher risk approach to using the Peak Tracker to determine what frequency of curtailment and degree of accuracy would result:
Conservative Approach:
Check Peak Tracker at 9 am and trigger 5-hour curtailment plan if the forecasted peak is above 20,000MW and then above the top 5 peak once established.
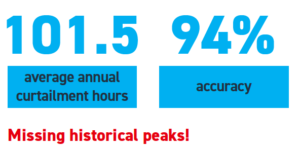
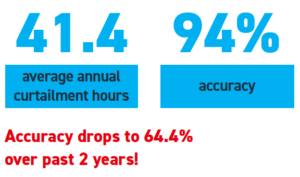
Higher Risk Approach:
Check Peak Tracker at 12pm and trigger a 2-hour curtailment plan if forecasted peak is above 20,000MW or above #5 peak once those are established.
Examples of Unusual Peak Events That Expose Peak Tracker Limitations
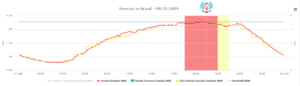
July 19, 2019: A fast moving early peak
July 19th is an example of an early peak where the risk probabilities of different hours shifted quickly. Peak tracker continued to identify the later hours as the likely peak long after the peak had occurred. The above image is from NRG Peaks highlighting, in advance, the highest hours of risk.
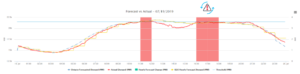
August 21, 2019: The number 6 peak you likely didn’t hear about
Peak Tracker was displaying IESO forecasts which were significantly under-forecasting Ontario demand versus most similar days. Checking the Peak Tracker at either 9:00am or 12:00pm would not have suggested a high risk of a peak event. NRG Peaks customers were notified and issued alerts despite non-supporting IESO power data. This peak became #6 in the 2019-2020 base period by only 67 MWs and represented a very high-risk event.
NRG Peaks Advantages
Intuitive Alert Bands:
The service includes colour coded alert bands (high, medium, low risk) which identify the relative risk of any hour becoming one of the 5 Ontario peaks.
Actionable Notifications:
Notifications are provided day-ahead, while alerts are issued the morning of. If conditions change, communications are made to update subscribers of changing risk profiles to the relevant hours.
Advanced Web Platform:
Information is also displayed on a state-of-the-art web-based dashboard which includes access to individual facilities power data for helpful referencing and reporting.
Most major ICI participants in Ontario look beyond IESO’s Power Data to minimize their curtailment hours while enhancing their ability to accurately hit the 5 Ontario peaks.
The most prominent service is provided by NRG Peaks who work with more than 50% of the participating megawatts in the ICI program. The service addresses many of the limitations of the Peak Tracker with a range of features that lead to higher accuracy of identifying peak hours and eases much of the complication around ICI participation.
Comparison

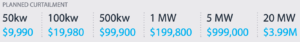
Annualized Lost Saving Opportunity with Peak Tracker vs. NRG Peaks
Summary
IESO’s power data, including the Peak Tracker, is an essential free resource for many Class A customers participating in the Ontario ICI program, but it has limitations. Using only the Peak Tracker, an organization will need to set its own curtailment thresholds, actively and frequently visit the website, be prepared to curtail more often, and should expect to miss a higher number of peaks. For organizations with a small curtailment contribution, this may be the optimal approach. For most active participants in the ICI program, the benefit of a premium service is clear and overwhelming.
Extra downtime and lost savings can quickly outweigh the free price tag of the IESO Peak Tracker. Consider optimizing your approach with a premium peak advisory service like NRG Peaks.
Call Us For a Free Assessment:
1-888-523-5620
info@workbenchenergy.com
